


Calculating a 6D reduction of Listeria monocytogenes with temperature loggers
The NSW Food Authority released the document “Listeria Management Program” (NSW/FA/FI034/0809) in 2008 which detailed guidelines for the management of Listeria monocytogenes within the retail and wholesale process.
In it was a table of process times and temperature to deliver a 6D reduction of Listeria monocytogenes. In plain English, that’s the amount of time required to kill 99.9999% of the Listeria monocytogenes. The table has been included below in my results. There are two columns for original data because it appears that there is a time in minutes and a time in seconds version and the time in minutes version is the one on their web site now.
The theory is that at 60°C the bacteria starts to die, but would require 44 minutes to reach a 6D reduction. At 65°C this time is reduced to 10 minutes and by 73°C it is below a minute.
The problems with calculating the required time
While the table is easy enough to understand, the problem is that the temperature is not constant. In reality the temperature will rise from 60°C up to some peak where it will fluctuate slightly, and then drop down again. All the time above 60°C needs to be included but how are they added up.
The other issue is about the fractions of a degree. The table shows the time for 63° (18 minutes) and 64° (13 minutes) but what if the temperature was 63.5°C. It will obviously be faster than 18 minutes but not as fast as 13 minutes.
A mathematical model for 6D reduction of Listeria monocytogenes
What we needed to do was to create a mathematical model for the table. By inverting this model we can then work out the contribution each second or minute made, and by integrating the area under the curve we end up with a value from 0 upwards, where less than 1 is a fail and above 1 is a pass.
What we found was the formula:

gave almost perfect results.
The table of values show the original values from the NSW Food Authority and the calculated results. Note that there are two sets of data from the NSW Food Authority – one provided in minutes and one provided in seconds. All times are shown in minutes.
| Temperature (°C) | Original (s) | Original (m) | Calculated |
| 60 | 43.6 | 44 | 45.3 |
| 61 | 32.1 | 33 | 33.0 |
| 62 | 23.6 | 24 | 24.1 |
| 63 | 17.4 | 18 | 17.5 |
| 64 | 12.8 | 13 | 12.8 |
| 65 | 9.4 | 10 | 9.3 |
| 66 | 6.9 | 7 | 6.8 |
| 67 | 5.1 | 6 | 5.0 |
| 68 | 3.7 | 4 | 3.6 |
| 69 | 2.8 | 3 | 2.6 |
| 70 | 2.0 | 2 | 1.9 |
| 71 | 1.5 | 1.4 | |
| 72 | 1.1 | 1.0 | |
| 73 | 0.8 | 1 | 0.7 |
| 74 | 0.6 | 0.5 | |
| 75 | 0.4 | 0.4 | |
| 76 | 0.3 | 0.3 | |
| 77 | 0.2 | 0.2 | |
| 78 | 0.2 | 0.2 | |
| 79 | 0.1 | 0.1 | |
| 80 | 0.1 | 0.1 | |
| 81 | 0.1 | 0.1 |
Though a picture is worth a thousand words:
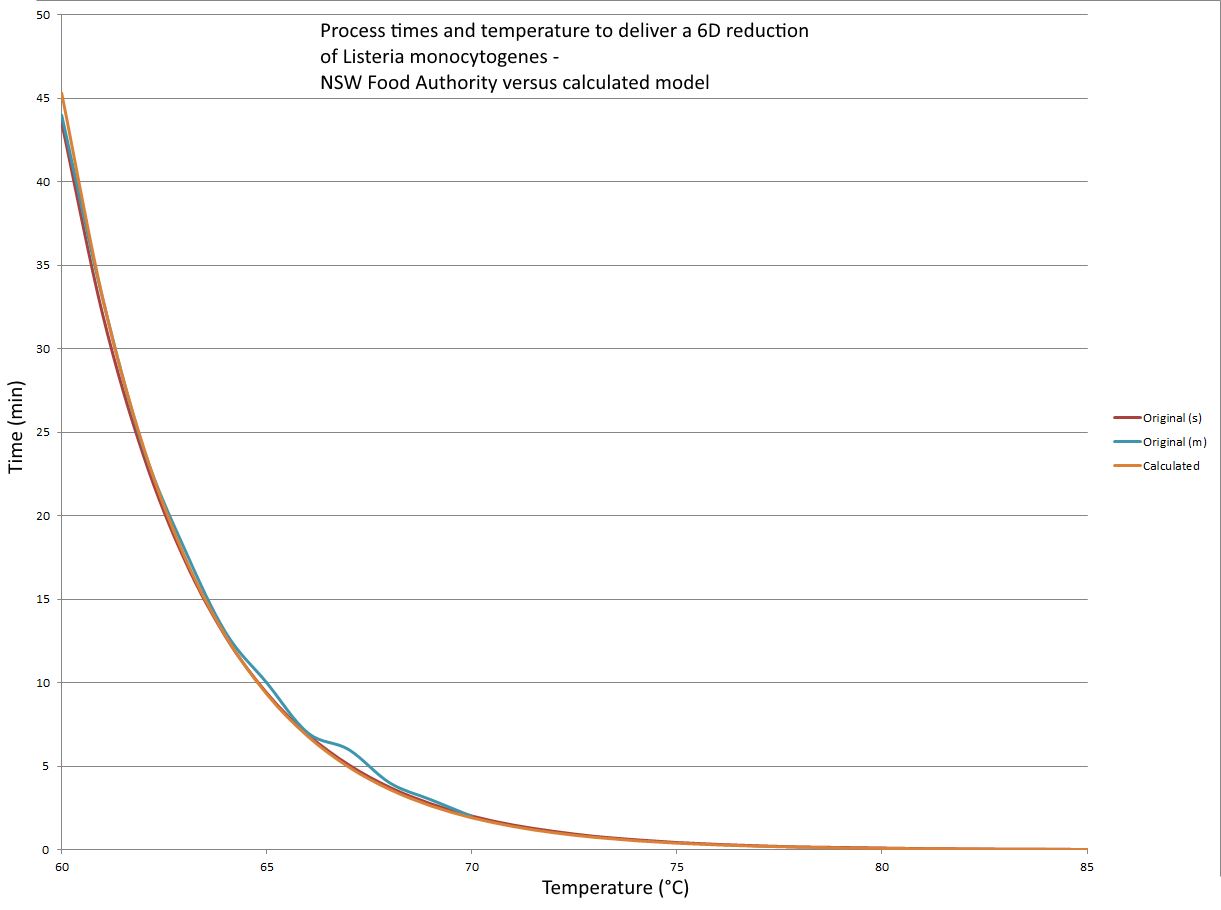
What we discovered is that there is more variation between the minute and second models provided in the two versions of the table than between our model and the seconds version.
This simple formula now allows us to accurately predict when a 6D reduction in Listeria monocytogenes occurs.
eTemperature now tests for a 6D reduction in Listeria monocytogenes
The post Calculating a 6D reduction of Listeria monocytogenes with temperature loggers appeared first on OnSolution.