Understanding thermal latency and using the capsule
The most common question caused by thermal latency...
"Why doesn't the logger show the same temperature as the fridge?"
There are a number of reasons why two temperature monitoring devices (like a logger and a fridge thermometer) will disagree. In this post I want to just focus on temperature latency.
In laymen’s terms, temperature latency is how quickly or slowly something takes to change temperature.
For example, if you take a small 200mL bottle out of the fridge, and a 2L bottle at the same time, the 200mL will reach room temperature much faster than the 2L bottle.
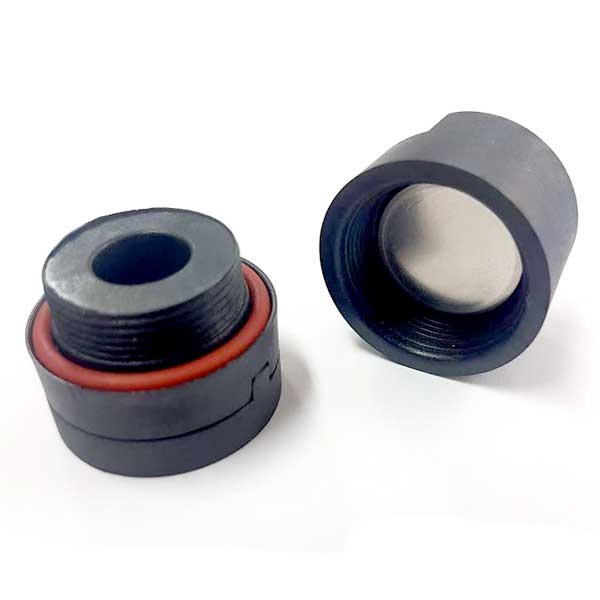
The Thermochron Capsule
There is a simple device that makes the thermochron water proof – the capsule. Thermochrons simply sit in it, and you screw the lid on. Quick and easy!
The capsule + thermochron combination is ideal for monitoring lakes, cooling towers, and many natural habitats.
BUT how does it go when monitoring something that is rapidly changing temperature? Does the thermal latency of the capsule significantly impact the thermochron?
A simple test
We did a simple test. We put a thermochron in a capsule and another in a zip lock bag. We set them to log every 5 seconds.
We placed both of them in a bowl, and then poured boiling water over both of them.
10 minutes later we took them out and downloaded the results.
The results...
There are a couple of quick observations that can be made.
1. Never use the same name for both loggers. The yellow one was the thermochron in the zip lock bag and the blue one was in the capsule.
2. Yes, the capsule had a significant impact on the readings and was very noticeable within the 10 minutes of this experiment. If your temperature is changing within minutes, don’t use a capsule. If it is slowly changing (e.g. 1° every 5 minutes) then a capsule is probably fine.
3. A boiling kettle is not 100°C. If it was, you would have a kettle of steam, not hot water. No real surprise.
4. The boiling water cools quickly. No surprise there either. We have all had hot soup and we just waited 5 minutes for it to cool down.
But what is the true temperature?
Given that this is the graph, I then asked a number of people what they thought the actual temperature was. Before scrolling down, I would recommend that you have a guess.
HINT: One person thought it was a flat line at 85°. Another started at 90° and had a line sloping down to 80° at the end. Both of these were wrong.
Some simple rules to understand a temperature chart
The most important rule to know is that the temperature of any item will always be moving towards the ambient temperature. That is, if the temperature is currently 24°, every item in the room will be heading towards 24°C. If something is at 30°, then it will be cooling down. If it is at 20° then it will be warming up.
(Unless it is something like a heater or fire, or a living being that generates its own heat).
The second rule is that things will approach the temperature at different speeds thanks to thermal latency.
An obvious rule but most people don’t give it much thought, is that temperature is always changing which means that a temperature logger or thermometer is chasing a moving target.
Let's put theory into practice
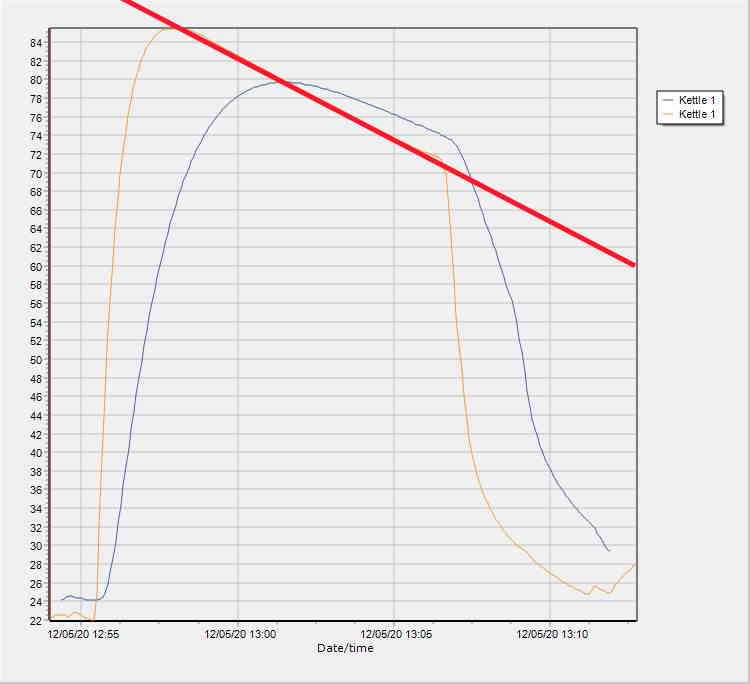
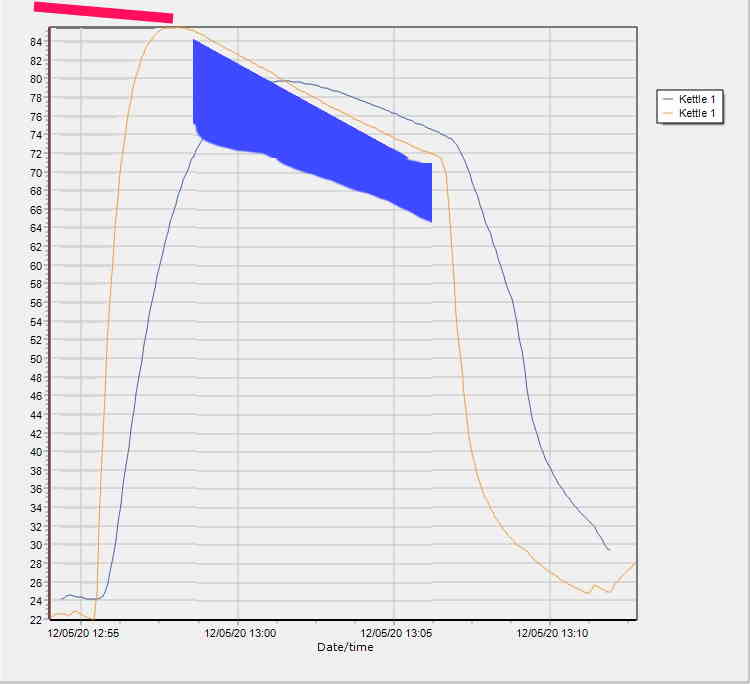
Looking at the first orange line, we know the logger is heading UP, so the temperature has to be above the line somewhere. I made it the ugly blue section.
The red line above it is a reasonable guess. It could be higher. It can’t be lower.
The original guess of a line that went all the way along the top looked reasonable based on this first chunk of data.
But at the end of the red line, something interesting happens with the orange line – it changes direction.
Now the temperature needs to be below the line. The blue area shows the area we now need to be looking at.
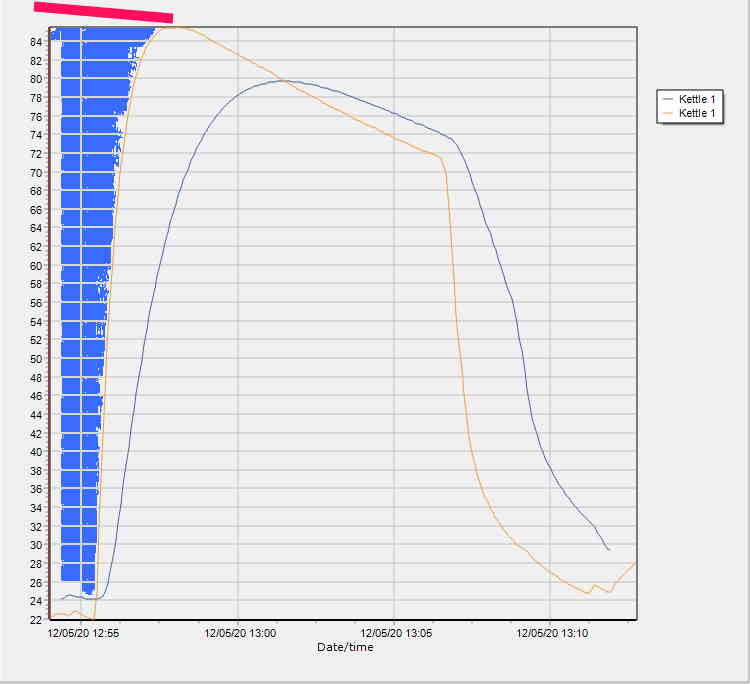
Fortunately the second graph gives us something really interesting to compare it with.
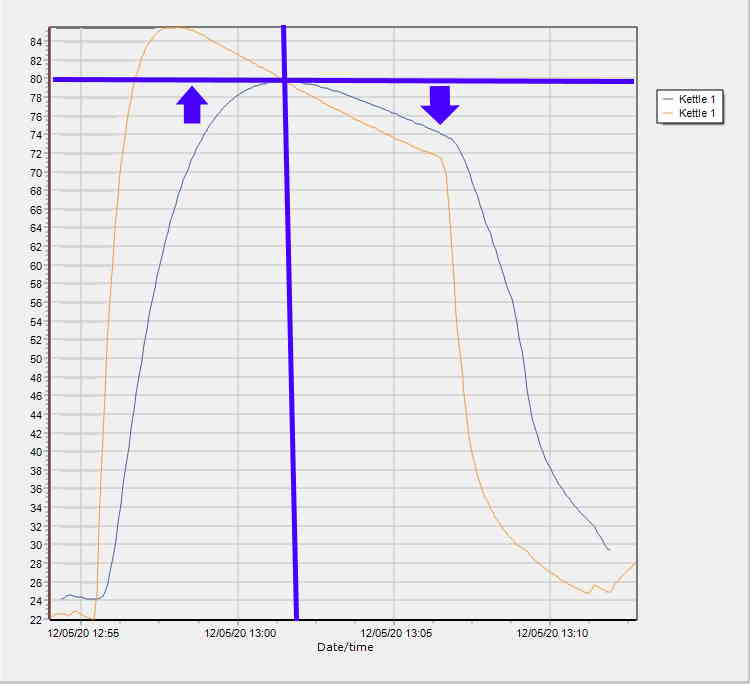
When looking at the second (blue) line, we know the tempature is above it for the first half, and below it for the second half.
It is at the point of the think vertical line that it changes direction. This is the point at which the actual temperature dropped below the slower moving logger.
It also happens to be the same temperature as the orange line.
We can fairly confidently now assume the orange line is reliably following the actual temperature.
The red line is now a good estimate of the actual temperature.
We can see the thermal latency of the first logger meant it took a couple of minutes for it to go from room temperature up to 85°, but once it reached temperature it managed to reliably follow it.
The second logger, in the capsule, took five minutes to warm up, and then was unable to reliably track the changing temperature.
For this particular experiment the capsule would not be a good idea.
Confused?
It made sense to me. The others stared at me blankly. I suspect I’m not doing the best job explaining it.
BUT if you do have results that aren’t making any sense, just remember that we are here to help. Sometimes we need to explain how weird results can be true, and sometimes we need to explain why it can be discarded.
As you saw from this exercise, there is information that can be trusted, information that can be disregarded, and some that needs to be considered with caution.