


eTemperature: Changing the line thickness in the report
The issue
A customer asked if they could change the line thickness in the graph on eTemperature. It was too thin for photocopying if needed.
The solution
eTemperature allows users to customise many aspects of the report. This feature is a very advanced feature and demonstrates the tradeoff between pure power and simplicity. This feature is pure power. Anyone familiar with other custom report generators will be able to use it easily.
For others, stick to these instructions and don’t wander too much and you will be fine.
Instructions
The original log looks like this:
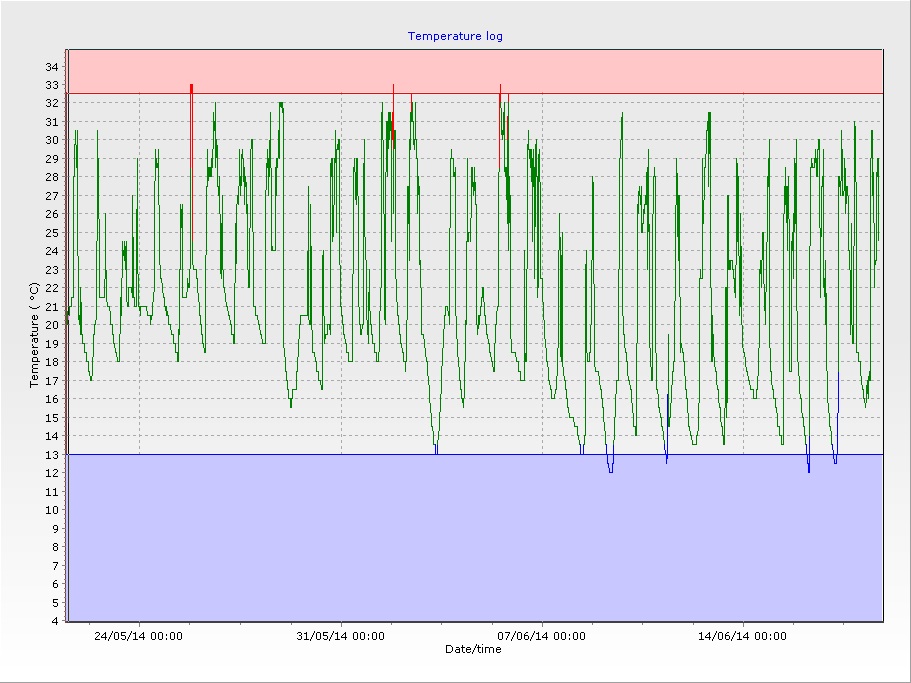
On the “Graph + Details” report it looks like this:
Our aim is to make the line thicker.
Step 1: Open the report editor
Select the “Options” button (top right), then select the “Display” tab. At the bottom of the tab is the “Edit reports” button.
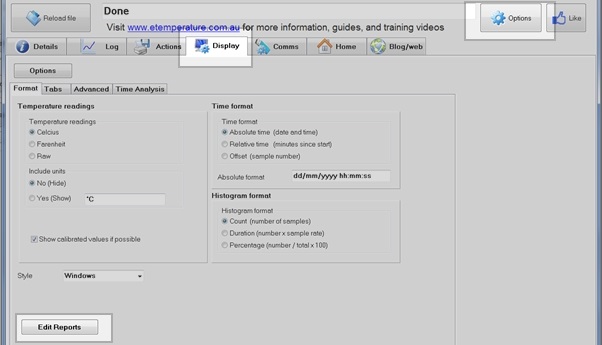
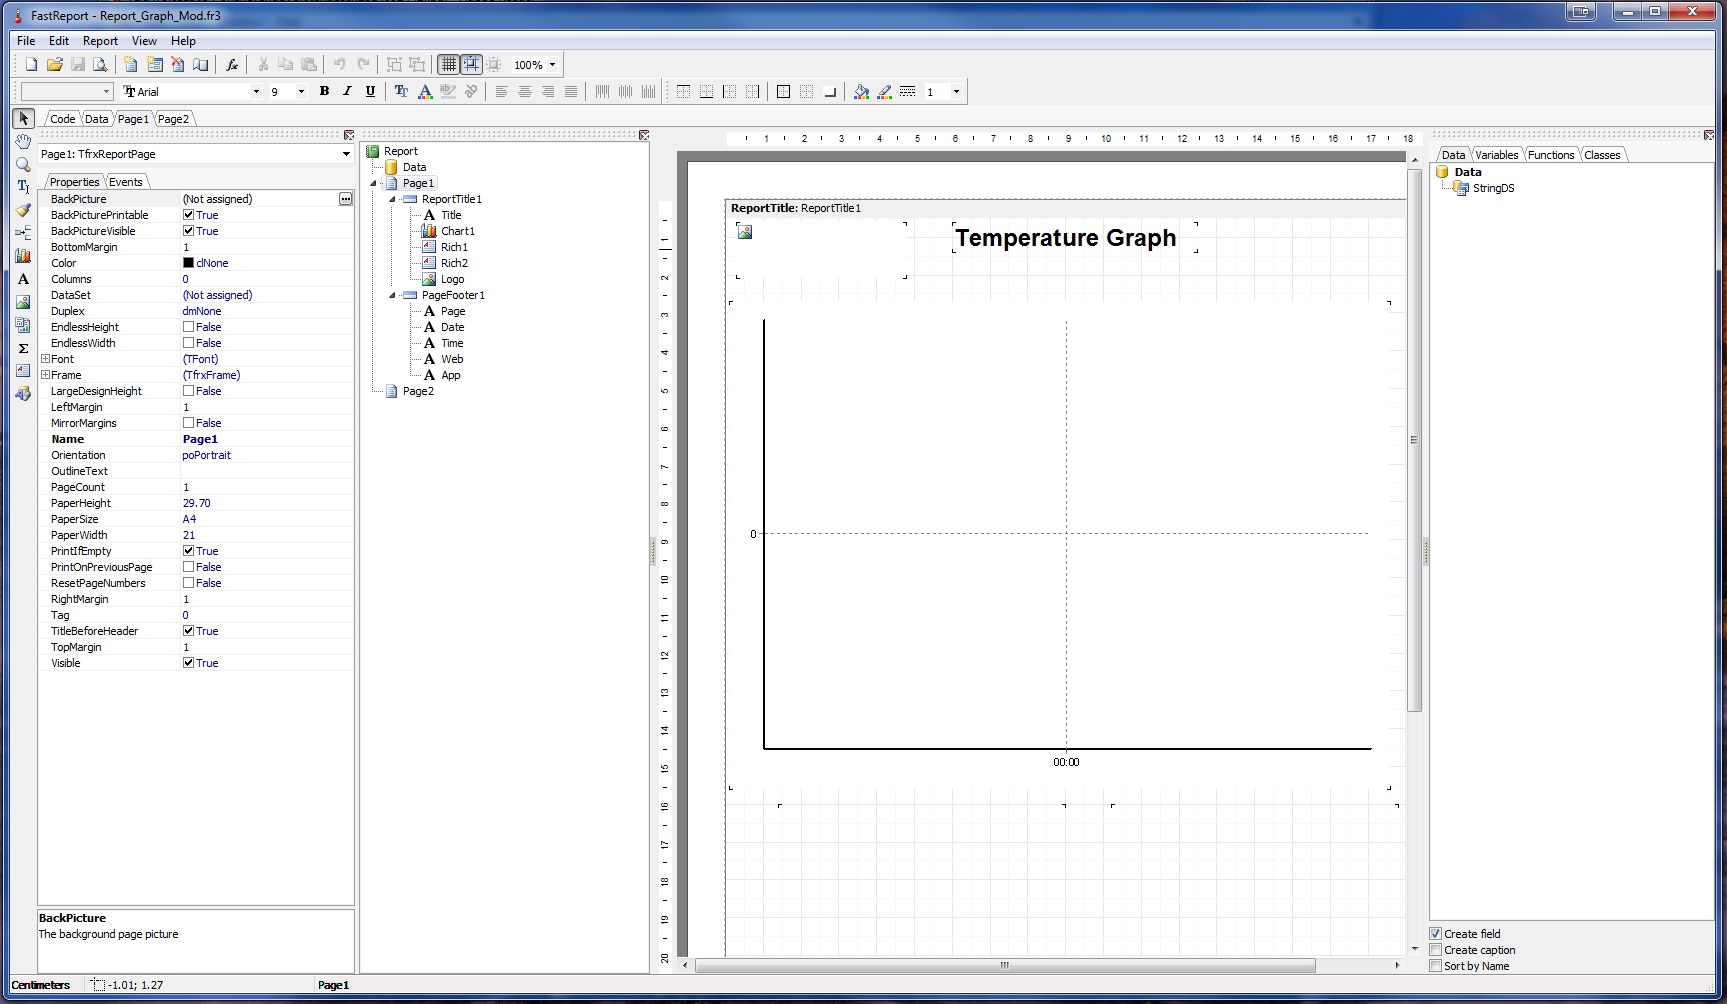
This will then display the following screen.
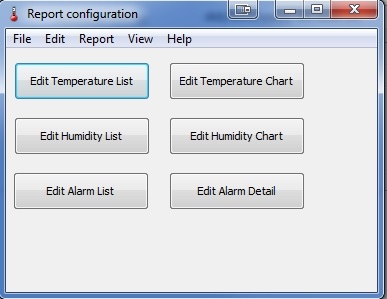
Press the “Edit Temperature Chart” to display the following setup screen.
Step 3: Set the graph line thickness
The following setup screen is now displayed.
Click on the actual graph and the screen will change to:
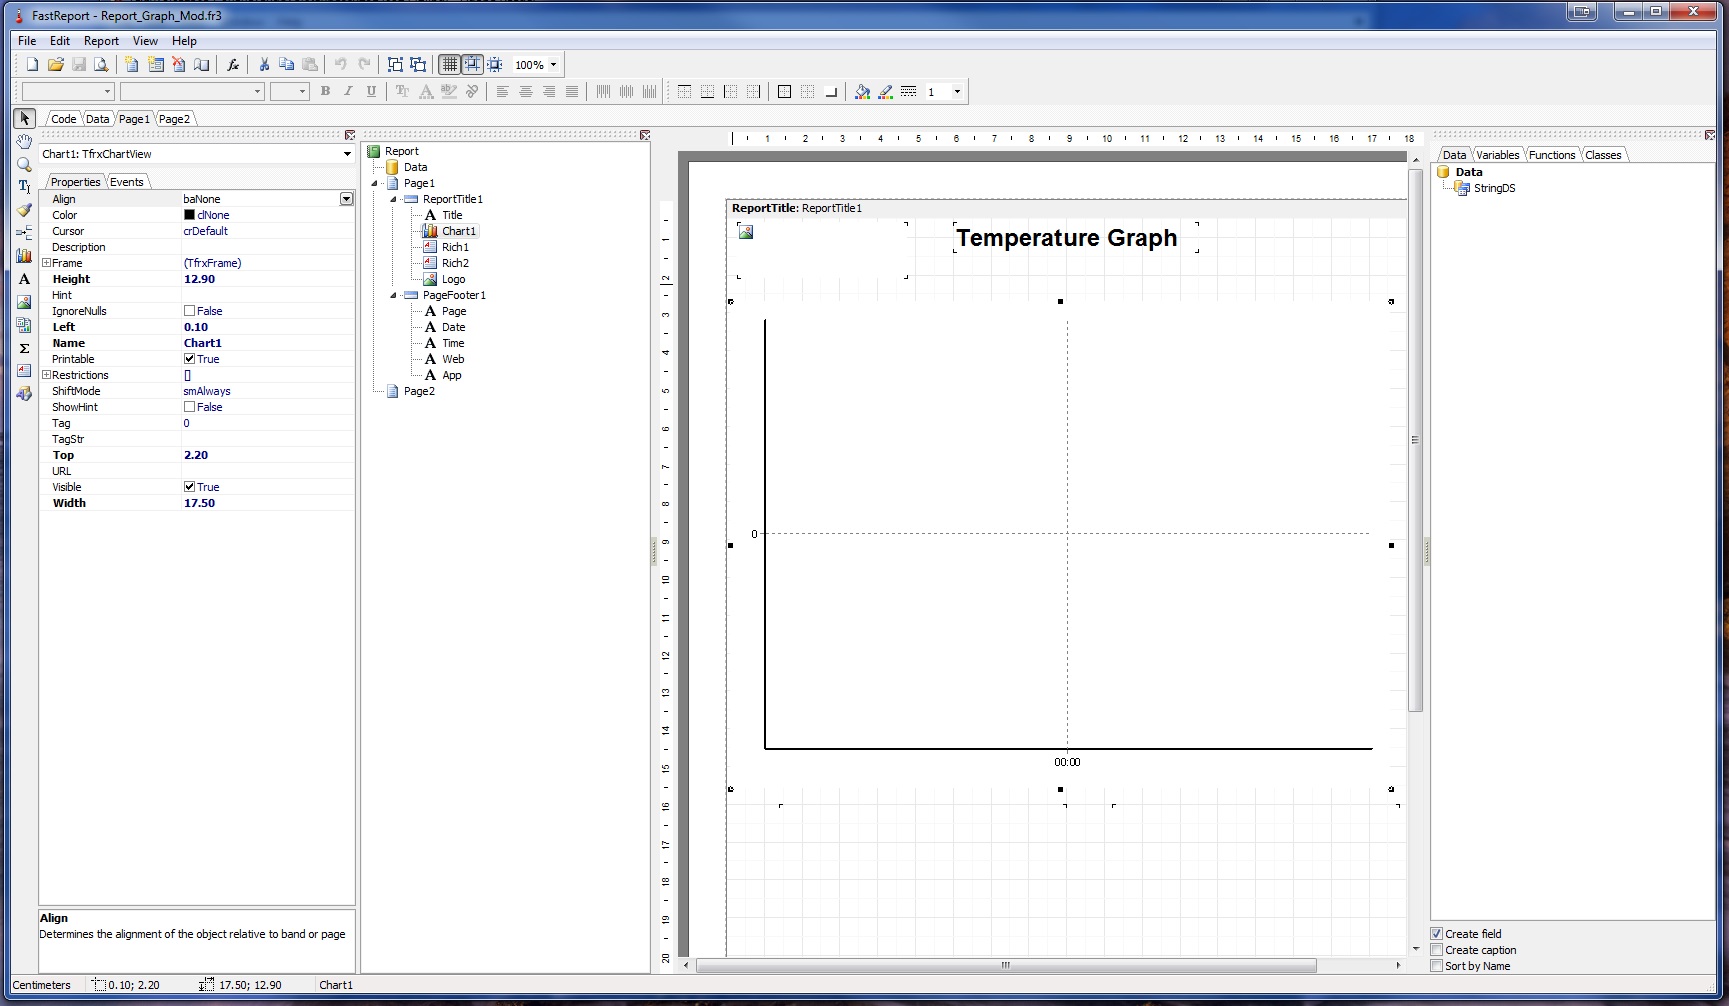
This shows that the properties on the far left are for the item that you have selected. This makes it possible for you to modify properties such as the font size and colour of text.
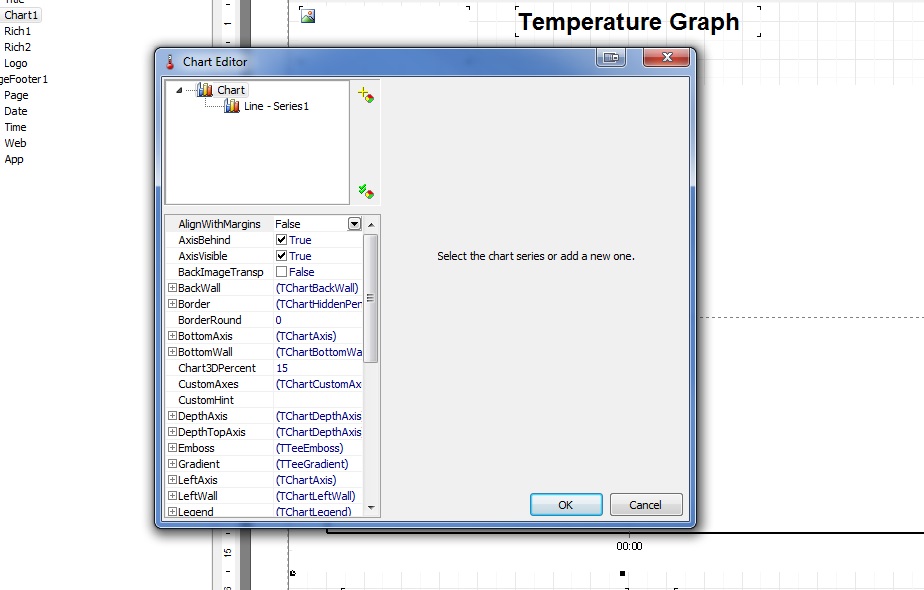
Double click on the chart and you will then see a chart editor form:
Select “Line – Series1” and the properties below it will change:
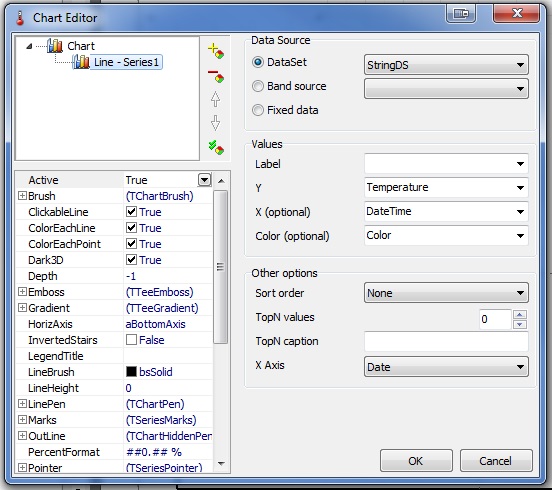
Scroll down through the properties (bottom left) until you see “Line Pen” and press the “+” next to it to expand the properties below it. You will then see “Width”. Change it to a slightly higher number.
For demonstration purposes I changed it to 5. A value between 1 and 3 is recommended.
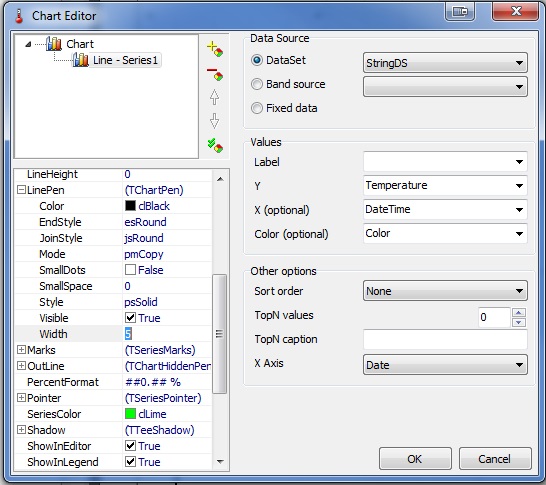
Press “OK” to close this form, then press the save button on the report and close it.
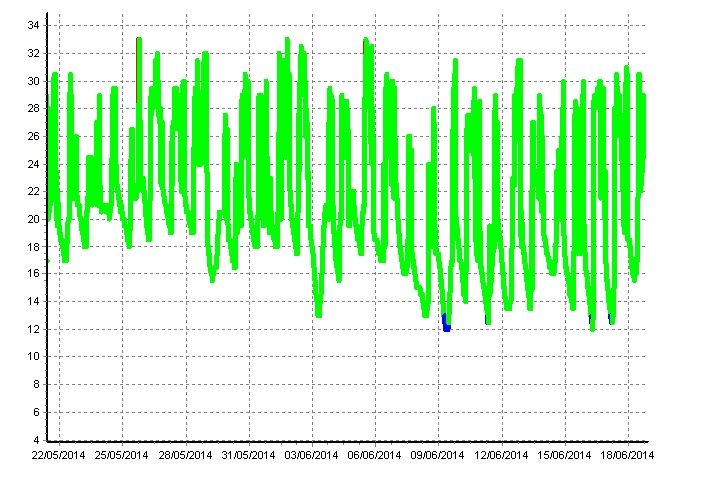
Step 3: Rerun the report
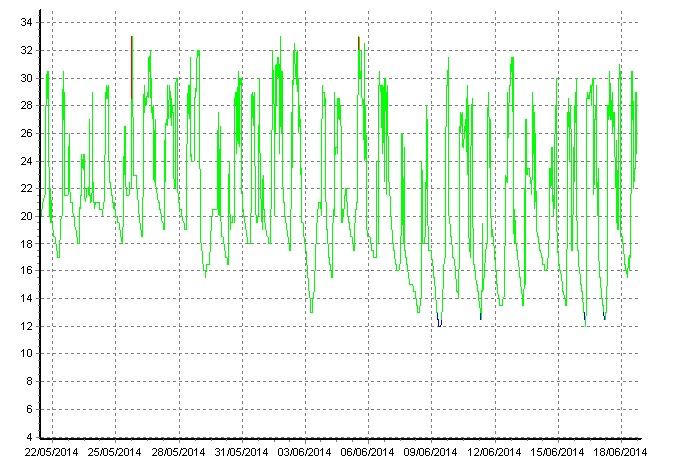
Now when you run the report the line thickness will be signficantly changed. In my case the reort now looks like this:
Comments
The changes to the report are automatically saved to the hard disk and will be used from now on. If they aren’t saved then make sure you have read/write access to the eTemperature folder, or have someone run eTemperature with administrator rights.
There is a manual available explaining how to use the editor. Contact [email protected] or visit the Software Downloads page to get a copy of the manual. Our recommendation is to ask us how to do the changes.